This blog is all about Learning from Stock Market! All the analysis is for educational purpose only, I am not a SEBI registered analyst. So before taking any investment decision do your own analysis. I'll not be responsible for any loss arising out of any information, post or opinion appearing on this blog. Investors/traders are advised to consult financial consultant before acting on any such information or post.
Sunday, January 14, 2018
Pick of the week - Usha Martin
The Stock of Usha Martin ltd is currently Trading at 30.5. It 52-week high/Low Stands at 30.5/17.00. It is gradually moving up with Higher top and higher bottom pattern from last couple of years. However on a longer period chart the stock has formed a downward sloping channel pattern and gave a breakout at 25-26 range on both weekly and Monthly charts.
The breakout was supported by huge volumes and the 14-period RSI is quoting above 69 which is indicating a momentum on the stock price.
Last week, stock has breached a major resistance at 30 level, which is kind of cup and Handle pattern breakout. Going forward we may see a rally. Hence we recommend to BUY the scrip at CMP with Target of 45, 66 and 90 in Short, medium and long-term respectively with SL of 26.8.
The breakout was supported by huge volumes and the 14-period RSI is quoting above 69 which is indicating a momentum on the stock price.
Last week, stock has breached a major resistance at 30 level, which is kind of cup and Handle pattern breakout. Going forward we may see a rally. Hence we recommend to BUY the scrip at CMP with Target of 45, 66 and 90 in Short, medium and long-term respectively with SL of 26.8.
![]() |
| Usha Martin Cup and Handle Breakout |
![]() |
| Usha Martin |
Wednesday, January 10, 2018
Stock on Radar : Diamond Power, Sumeet Industries, welspun Corp
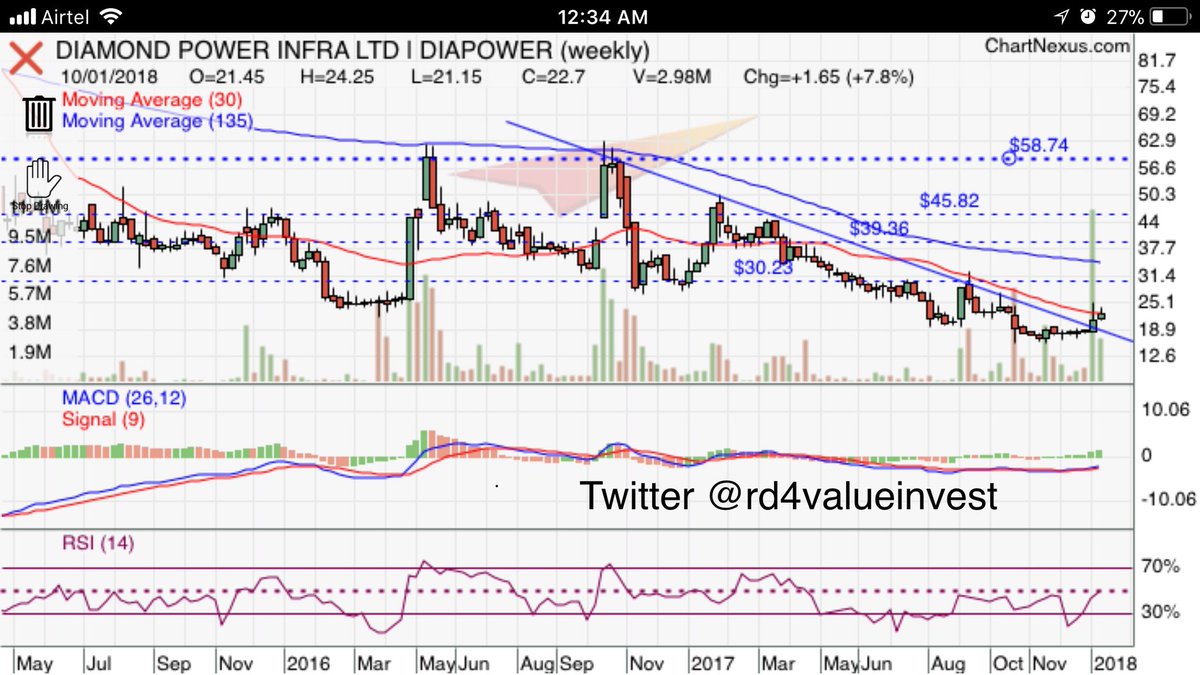
Diamond Power and Infra

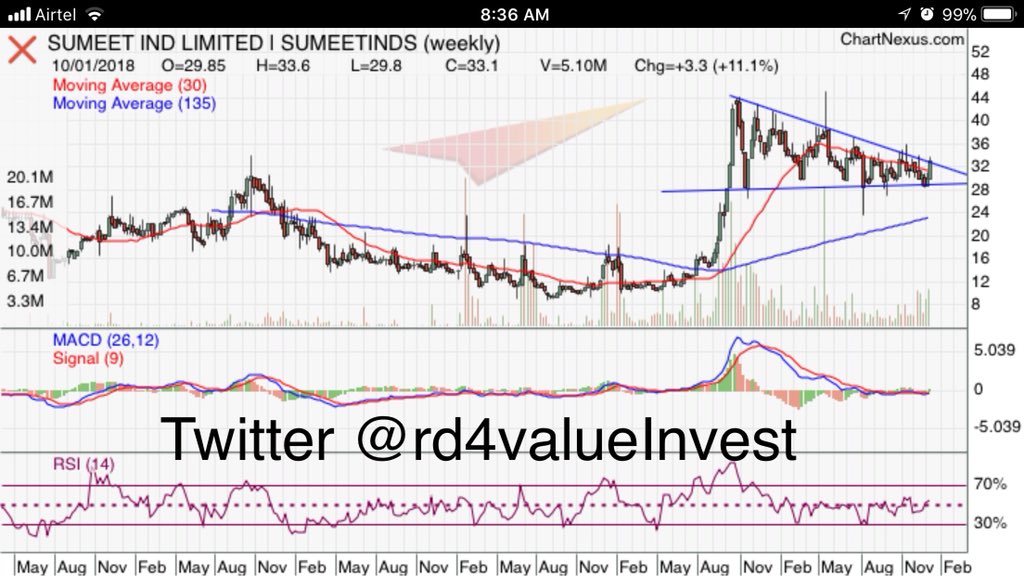
Sumeet Industries

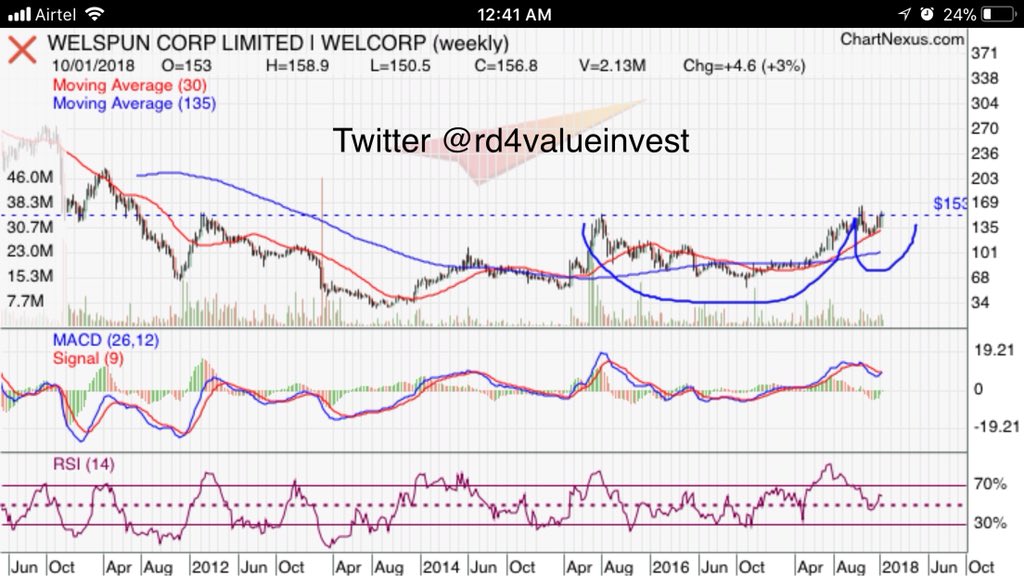
Welspun Corp

Note: All these Tweets were published on Twitter. Follow me @rd4ValueInvest. Going forward I will try to add fundamental data to my posting on blog along with Technical.
Subscribe to this Blog by Mail
Sunday, January 7, 2018
Stocks on Radar - TCI Finance, Vedanta, Suditi Ind, Orchid Pharma and Shah Alloys -8thJan
Friends, here are my 5 Pandvas for Week of 8th to start with, TCI Finance, Vedanta, Suditi Industries, Orchid Pharma, Shah Alloys
TCI Finance has given a break above 28.6 which was strong resistance zone. The stock has an immidiate target of 35 and then 50 Rupees in short term. Stop Loss of 21 should be considered on a closing basis.
![]() |
| TCI Finance |
A strict stop loss of 295 should be considered.
![]() |
| Orchid Pharma |
Shah Alloy has given a break out of Symmetrical Triangle pattern with Huge volumes. One can buy on CMP for a Target of 23 & 39 with Stop Loss of 18 on a weekly Closing basis.
If you have liked my post please follow me on Twitter Handle - @RD4ValueInvest and Subscribe to my blog.
Monday, January 1, 2018
Stocks on Radar–NMDC, GTN Industries, Hanung Toys, Gammon Infra
NMDC a good breakout, if it holds can go to 240 in 6-8 weeks.
Gammon Infra- its make or break, if it manages to close above 4 with Volumes, it can go to 6 and 13.
GTN Industries - given a break out from Symmetrical Triangle, Can you to 24 and 33

Tuesday, December 26, 2017
Ashiana Housing CMP 183 - Can rake in money
A good accumulation is happening in Ashiana Housing around 180 levels. On 20th of December SBI mutal fund bought 1.7% stake in Ashiana Housing. I feel this stock is grossly underown. On Valuation front it looks fairly valued and can get re-rated in next couple of quarters based on Government focus on low cost housing theme.
Technically price consolidatation is happening in the range of 165 and 184 from last 20 weeks or so. Ashiana needs to break 185 with Volumes to resume the uptrend. It can reach first target of 213 and subseqent target of 290 in next 2-3 weeks and 3 months respectively.
Note: I reserve the rights to be wrong! take advice from your financial advisor before investing.
Technically price consolidatation is happening in the range of 165 and 184 from last 20 weeks or so. Ashiana needs to break 185 with Volumes to resume the uptrend. It can reach first target of 213 and subseqent target of 290 in next 2-3 weeks and 3 months respectively.
Note: I reserve the rights to be wrong! take advice from your financial advisor before investing.
Monday, December 25, 2017
Technical Chart - Prime Focus a multibagger in making
After a long break from my blog, Let us focus on my next pick from Movies and entertainment sector.
Prime Focus Ltd CMP 115 has broken on a weekly chart after a sideways consolidation of almost 9 months. It was moving in range of 90 to 115. One can buy Prime Focus once it gives a confirmation by trading above 116 for an hour, a strict stop loss of 107 should be considered to cut down the position on a closing basis for an initial Target of 165 and 200 in next 3 and 6 months respectively. CMP is clsoing price on 22nd of December 2017

Fundamentally, Prime focus looks good having fair valuation with Positive financial Trend having good last couple of Quarters.
If this post has helped you, please subscribe to my blog and Twitter handle: "@rd4valueinvest". Share your feedback.
Prime Focus Ltd CMP 115 has broken on a weekly chart after a sideways consolidation of almost 9 months. It was moving in range of 90 to 115. One can buy Prime Focus once it gives a confirmation by trading above 116 for an hour, a strict stop loss of 107 should be considered to cut down the position on a closing basis for an initial Target of 165 and 200 in next 3 and 6 months respectively. CMP is clsoing price on 22nd of December 2017

Fundamentally, Prime focus looks good having fair valuation with Positive financial Trend having good last couple of Quarters.
If this post has helped you, please subscribe to my blog and Twitter handle: "@rd4valueinvest". Share your feedback.
Subscribe to:
Posts (Atom)
Why Cutting losses using Stops is Important in Trading
One should be ready with trailing stops for the stocks which are trading near their Stop Loss levels. Don’t hesitate to cut the position at...
-
India bulls Real Estate has given a break out on Daily and Weekly charts with good Volumes. Chart for study only. IB Real Estate Daily C...
-
#Birlasoft Daily Chart Keep eyes on close above 81.5 ( DCB) Volumes are building #PriceAction will change above 81.5 for short term. #Kee...
-
Spice mobile has give a break out from downward trend line with huge volume on daily chart. Immediate Target could be 20, 35 Rupees in sh...